The relative contribution of grazing and climate variation on vegetation change in alpine area
Árinið av seyðabiti og broyttum veðurlagi á plantuvøkstur í fjallaøkjum
Anna Maria Fosaa
Faroese Museum of Natural History, V. U. Hammershaimbsgøta 13, FO-100 Tórshavn, Faroe Islands. Email: annamariaf@savn.fo
DOI: http://dx.doi.org/10.18602/fsj.v62i0.28
Abstract
For more than a decade, a warming and grazing experiment has been carried out in the alpine area of the Faroe Islands. Ten Open Top Chambers (OTCs) were placed inside an enclosure with control plots both inside (CtrlE) and outside (CtrlO) the enclosure. The difference in vegetative growth of the two species Salix herbacea and Polygonum viviparum and graminoids were monitored as well as the frequencies of the four functional types: herbs, graminoids, woody species and bryophytes. It was found that warming generally increased leaf length by around 30% with similar or larger increases in photosynthetic leaf area. Grazing reduced leaf length by around 30% for graminoids and Polygonum viviparum, but only by around 10-20% for Salix herbacea. The changes in frequencies of functional types were most pronounced for bryophytes and woody species during the latter part of the experiment when both grazing-exclusion and warming increased the frequencies of bryophytes and decreased the frequencies of woody species.
Úrtak
Í meira enn tíggju ár er kannað, í hvussu stóran mun upphiting og seyðabit ávirka plantuvøkstur á 600 metra hædd á Sornfelli. Kanningarnar eru gjørdar í tíggju smáum vakstrarhúsum, ið eru opin í erva (OTC). Tey vóru innan fyri eitt hegn, har royndarøki uttan upphiting (CtrlE) eisini vórðu kannað, umframt eisini royndarøki uttan fyri hegnið (CtrlO). Munurin á vøkstri hjá urtapíli Salix herbacea, aksgrónari bløðkuurt Polygonum viviparum og grøsum og munur á tíðleika av urtum, grøsum, dvørgrunnum og mosum varð kannaður. Fyri gras og aksgrógvnari bløðkuurt vísti úrslitið sum heild, at blaðlongdin øktist umleið 30% við upphiting og minkaði umleið 30% av seyðabiti. Blaðlongdin á dvørgrunnum broyttist á sama hátt, men bara við 10-20%. Tíðleikin broyttist serliga á mosa og dvørgrunnum. Tíðleikin av mosum var nógv hægri í økjum uttan seyðabit, men hægst á økjum við upphiting og ongum seyðabiti. Hjá dvørgrunnum var umvent við størsta tíðleika, har seyðurin bítur og minst við upphiting uttan seyðabit.
Abbrevations
OTC Open Top Chambers, warmed plots
CtrlE non-grazed plots
CtrlO grazed plots
Introduction
In ecosystems where grazing is the prevailing land use factor, it is difficult to study the effects of climate change on biota, without considering the effects of grazing (Speed et al., 2012; Olofsson et al., 2009). We know very little about how grazing and warming interact (Fuhlendorf et al., 2001; Olofsson et al., 2009) and the relative effect of these two factors on the vegetation is difficult to assess, because both occur in numerous spatial and temporal scales and are affecting the vegetation differently.
The change of the vegetation often lags behind in a warming climate while the effect of grazing is more immediate. Therefore, many studies only consider grazing as the major agent of changing vegetation (van der Wal, 2006; Olofsson, 2006). Other studies consider changing climate as the major agent of change (Elmendorf et al., 2012; Oberbauer et al., 2013). But as the effects of climate change have become more evident in the last two decades, many of the recent studies are dealing with both grazing and climate warming. (Fuhlendorf et al., 2001; Klein, 2005; Olofsson et al., 2009; Speed et al., 2012).
In most cases, a warmer climate increases vegetative growth, and thereby results in larger photosynthetic area (Molau, 2000; Arft et al., 1999). Heavy grazing, on the contrary, usually reduces the growth of plants and the aboveground biomass (e.g. Austrheim et al., 2008; Evju et al., 2009), resulting in smaller plants and smaller leaves and thereby smaller photosynthetic area. With these opposing effects on the biomass, a simple conclusion could be that the net result is neutral. But this is not the case since the vegetation is responding differently to climate warming and grazing, depending on whether the focus is on species level, functional types or plant communities.
In alpine ecosystems, a warmer climate has been found to shift the distribution of trees and shrubs to a higher altitude e.g. Burga et al. (2001) and Walther et al.(2005). In these circumstances, herbivory and climate change oppose each other as herbivory usually constrains the advance of these functional types and to some extent actually causes a downward shift of trees and shrubs to a lower altitude (Speed et al., 2012). In long-term warming experiments in arctic and alpine areas, bryophyte abundance declined at moist sites (Hollister et al. 2005; Elmendorf et al., 2012). In grazed areas, bryophyte abundance may decline, not so much from grazing, but rather from trampling (Virtanen, 2000).
The Faroe Islands have been grazed for more than a thousand years, and the historical record has shown, that the vegetation had undergone extreme changes (Jóhansen, 1985). Hence, it is necessary to disentangle the effects of grazing from the effects of climate change. No studies have been made on the relative effect of grazing and warming in the area. But the few existing studies on the effect of climate on single species and vegetation zones show their vulnerability to changing climate (Fosaa et al., 2004; Fosaa, 2010). A relative short-term grazing experiment showed decreased biomass of the vegetation in both lowland and alpine areas in terms of decreased vegetation cover and lower vegetation height (Fosaa and Olsen, 2007).
In this paper, results are reported from an experiment in a mountain area in the Faroe Islands including both experimental warming and the effect of grazing. OTCs (Open Top Chambers) were used to induce experimental climate warming, as they allow investigations on ecosystem change in relative controlled conditions. In addition, the effect of grazing was studied in a fenced area in order to excluded grazing animals from the area.
Based on this experiment, an evaluation is made of the relative contributions of experimental warming and grazing on 1) changes in the frequencies of the four functional types: herb, woody, graminoid and bryophytes, and 2) changes in plant performance in terms of changes of leaf length and biomass of Polygonum viviparum, Salix herbacea, and graminoids. This was done in a decade-long experiment.
The study, thus compares changes in three different types of plots: 1) warmed and non-grazed plots (OTC), 2) non-grazed plots (CtrlE), and 3) grazed plots (CtrlO). It was expected that both the OTC plots and CtrlE plots would show increased vegetative growth, and that the increase in vegetative growth would be greater in the OTC than the CtrlE plots. It was also expected that the biomasses and frequencies of the functional types respond differently in the two types of treatment and that the strength of the effect may differ.
Material and methods
Study area
The study site is on the mountain of Sornfelli (62o04´N, 6o57´W) at 600 m a.s.l. on Streymoy in the central part of the Faroe Islands. The vegetation in the area range from open grassland vegetation with sparsely vegetated ground to Racomitrium heath vegetation with richly vegetated ground. Of the 25 species vascular plants species recorded from the site, Silene acaulis and Polygonum viviparum are the most frequent herbs. Salix herbacea, the only woody species on the site, is also frequent. Agrostis capillaris, Agrostis canina, Festuca vivipara and Desampsia flexuosa are the most frequent grasses. Frequent moss species at the site are Racomitrium lanuginosum, Hylocomium splendens, Rhytidiadelphus loreus and R. squarrosus as well as Polygonum alpinum. Epigeic lichens are recorded but, as they are very rare, they are not included in the study.
The plant communities defined from the site are the species-poor Koenigia islandica-community, and the species-rich communities Festuca vivipara-Agrostis capillaris-community, Racomitrium-community and Racomitrium-Salix herbacea-community (Fosaa, 2004).
The whole area is grazed, mainly by sheep, about 45 ewes per km2 (Thorsteinsson, 2001), in addition to hares and geese. The climate in the Faroe Islands is highly oceanic with annual mean precipitation around 1500 mm in the lowlands and with measurable precipitation on 75% of the days in the year (Cappelen and Laursen, 1998). The mean annual temperature at the top of the mountain (726 m a.s.l.) is 1.7°C. The mean temperature for the coldest month (February) is -2.0°C and the mean temperature for the warmest month (August) is 6.5°C (Christensen and Mortensen, 2002).
Sampling
In 2001, ten Open Top Chambers (OTC) (Molau and Møhlgaard 1996; Henry and Molau 1997) and ten control plots were placed inside an enclosure (CtrlE). The OTC´s are hexagonal polycarbonate chambers with a height of approximately 0.5 m and a diagonal diameter of slightly less than 1 m. These chambers are commonly used in experiments whose aim is to study the effect of climate change on plant species because they are generally considered to increase the temperature by 1-2 ºC (Molau and Mølgaard, 1996; Marion et al., 1997; Hollister and Webber, 2000). The OTCs were in the field during the winter during the whole experiment, but from time to time, some of them were blown away and established again in the following spring. In 2008, an additional set of 10 plots were established close to the others but outside the enclosure so that they were open to grazing. These plots are labelled CtrlO.
Temperature was measured inside and outside the OTCs during the period from 2006-2008 and from 2011 to 2014 (Table 1). In the first period, the temperature was measured by "TinyTag" data loggers and in the second period by "GeoPrecision" loggers. The loggers collected hourly soil temperature data. Two to three sensors were within OTCs, while two sensors were outside OTCs and are considered as controls. In the first period, the sensors were located on the soil surface and in the second period, the sensors were located 10 cm below the soil surface.
Table 1.The difference in mean temperature ΔT (°C) (in OTC boxes minus outside) measured at soil surface (2006-2008) and at 10 cm depth (2011-2013) in the summer (June, July and August).
|
|
Year |
Number of dataloggers |
Sornfelli (summer) |
|
ΔT (°C) soil surface |
2006 |
4 |
0.2 |
|
2007 |
4 |
1.083 |
|
|
2008 |
6 |
1.03 |
|
|
ΔT (oC) in soil 10 cm belowground |
2011 |
4 |
-0.55 |
|
2012 |
4 |
-0.50 |
|
|
2013 |
4 |
-0.74 |
The vegetation was sampled in 2001, 2008 and 2011 in OTC (warmed) and in CtrlE (grazing exclosure) plots. In addition, the CtrlO (grazed) plots were sampled in 2008 and 2011. The size of the plots sampled is 0.25 m2. These were subdivided into 25 (0.01m2) micro-plots. The presence/absence of each plant species was noted for each micro-plot, which yields a frequency value from 1-25 for each species for each plot.
In mid-summer 2005, 2008 and 2011, the leaf lengths were measured from three functional types: herb, woody and graminoid, represented by Polygonum viviparum, Salix herbacea and by leaves from the most common grasses (Festuca vivipara, Agrostis canina or Deschampsia flexuosa), respectively. Fifty leaves of each functional type were collected randomly from all three types of plots (OTC, CtrlE and CtrlO). In 2005 and 2011, the leaves were collected in late July and in 2008, in early August.
A biomass index was determined for Salix herbacea, Polygunum viviparum and graminoids, based on photos taken from each plot during the growing season 2011. This was done by estimating the percentage coverage in every micro-plot of the two species and the graminoids. A mean biomass index for each of the OTC, CtrlE and CtrlO was calculated by multiplying this value with the leaf length in 2011.
Data analysis
Monthly averaged temperature was calculated for each sensor as a mean of the summer months June, July and August. For this period, we calculated the average of the two OTC temperatures and the average of the two control temperatures. The difference between these two averages (ΔT) ought to represent the effect of the OTC on soil temperature.
The overall vegetation change was tested by grouping the vegetation into four functional types, which are: herbs (25 species), graminoids (6 species), woody (1 species), bryophytes (10 species). In order to assess statistically the response of the three types of treatment on the frequencies of the four functional types, a two way ANOVA model was used. The three different treatments (OTC, CtrlE and CtrlO) and the three years sampled (2001, 2008 and 2011) were used as categorical predictors (factors) and the frequencies of the four functional types as dependent variables.
The leaves that had been sampled for length analysis were measured with a measuring tape. In addition, 22 leaves of Polygonum viviparum and 22 leaves of Salix herbacea, sampled in 2005, were taped on a paper and scanned into the computer where the area of each leaf and its length were determined with the program: Able Image Analyzer (www.able.mulabs.com). If the shape of the plant is retained both width and length will increase in the same proportion, and one would expect the area to increase with the square of the length. A regression analysis was therefore used to establish the relation between the area and the length squared for each of these two species.
In order to assess statistically the canopy height of graminoid layer, herb layer and the dwarf shrub layer, a two way ANOVA model was likewise used to test the changes in leaf length of graminoids, Polygonum viviparum and Salix herbacea, respectively, with the three different treatments (OTC, CtrlE and CtrlO) and the three years sampled (2005, 2008, 2011) as categorical predictors (factors) and the leaf length of the three species as dependent variables.
The differences in biomass of graminoids, Polygonum viviparum, Salix herbacea and in the three different treatment were tested with the student’s t-test.
All statistical analyses were conducted using the STATISTICA Software Statistical Package for Windows (StatSoft Scandinavian AB).
Results
The soil surface temperature was higher than the belowground temperature. The daily temperature variation in summer had considerably higher range above compared to below (Fig. 1) ground, but the early morning temperatures were fairly similar. On average, the OTCs were warmer than the control plots by 0.2oC to 1.1oC above ground, whereas they were colder by 0.5oC to 0.7oC below (Table 1).
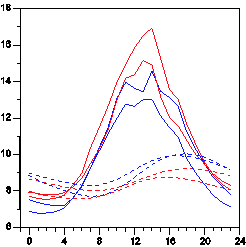
Figure 1. Average hourly soil surface temperature in july 2008 (continuous curves) and average hourly temperatures 10 cm belowground in July 2011 (dashed curves). Red curves are from two sensors in OTCs while blue curves are from two sensors in control plots.
For all the four functional types, we see inter-annual variations in average frequency, but there are also some more systematic temporal trends (Fig. 2). These were tested statistically by comparing frequencies in the beginning (2001) for OTC, CtrlE and CtrlO and end (2011) using the students t-test. For CtrlO, 2001 data from CtrlE were used.

Figure 2. Temporal variations of the frequencies of the four functional types in the OTC (squares), the CtrlE (diamonds), and the CtrlO (circles) plots. Symbols connected with lines indicate averages. Vertical bars indicate ± standard error.
The frequencies of herbs do not exhibit any systematic trends. The graminoids tend to increase through the period in all three kinds plots and these increases are significant (p<0.05). For the bryophytes, we see a strong increase in OTC, which is highly significant (p<0.0005) and a weaker increase in CtrlE (p<0.05), whereas there was a decrease in CtrlO (p<0.001). For the woody species, the only significant trend is a decreasing frequency in the OTC.
In the beginning of the experiment (2001/2008), there were no large differences in frequencies between the different kinds of plots (Fig. 2), but by the end (2011), some of the functional type’s exhibit differences, which were tested by a two way ANOVA (Table 2). For the herbs, the tests revealed no significant differences between the different kinds of plots. Similarly, no significant difference was found in graminoids between CtrlE and CtrlO, but graminoids were more frequent in OTC than in both CtrlE and CtrlO (p<0.05). The woody species were somewhat less frequent in CtrlE than in CtrlO (p<0.05) and considerably less frequent in OTC than in both CtrlO (p<0.001) and CtrlE( p<0.001). The most pronounced differences between different kinds of plots are seen in the bryophytes which were more frequent in OTC compared with CtrlE (p<0.05) and much more frequent compared with CtrlO (p<10-6). The bryophytes also had significantly higher frequency in CtrlE than in CtrlO (p<0.01).
Table 2. Results from a two way ANOVA test, where the difference in frequency in 2011 between treatments are tested for the four functional types.
|
|
|
F |
p |
|
OTC/CtrlO |
Herbs |
0.228 |
ns. |
|
|
Graminoids |
6.427 |
<0.05* |
|
|
Bryophytes |
43.45 |
<0.05* |
|
|
Woody |
13.37 |
<0.001** |
|
|
|
|
|
|
OTC/CtrlE |
Herbs |
2.57 |
ns. |
|
|
Graminoids |
7.14 |
<0.05* |
|
|
Bryophytes |
22.66 |
<0.001** |
|
|
Woody |
54.70 |
<0.001** |
|
|
|
|
|
|
CtrlE/CtrlO |
Herbs |
1.825 |
ns. |
|
|
Graminoids |
0.047 |
ns. |
|
|
Bryophytes |
7.587 |
<0.01* |
|
|
Woody |
3.937 |
0.057(*) |
The leaf length measurements indicate inter-annual differences, many of which are statistically significant (t-test) and presumably indicate different growing conditions in different years (Fig. 3). Leaf lengths were not measured when the experiment started in 2001, but we would expect them to be similar in all three kinds of plots initially. By the first measurements in 2005, there were already highly significant differences between leaf lengths in OTC and the two kinds of control plot for all three species (p<10-4 in all cases from t-tests). In 2011, we also found highly significant differences between CtrlE and CtrlO for all three species (p<0.001 in all cases from t-tests).
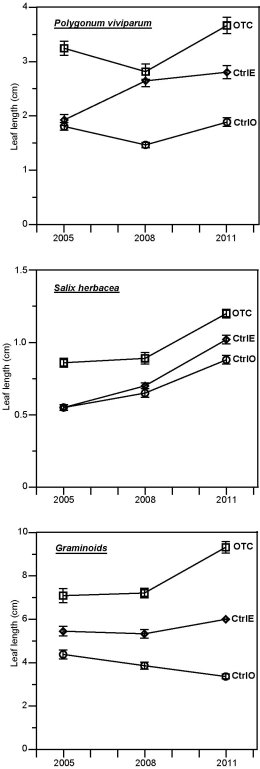
Figure 3. Temporal variations of leaf lengths in the OTC (squares), the CtrlE (diamonds), and the CtrlO (circles) plots. Symbols connected with lines indicate averages. Vertical bars indicate ± standard error.
The measured leaf areas are seen to be closely related to leaf length squared (Fig. 4) with R2 values indicating that the regression equations explained 71% of the variance for Polygonum viviparum and 66% for Salix herbacea. The regression lines did, however, have considerable offsets, especially for Salix herbacea. Using the regression equations, the area of a leaf may be calculated once the length is measured. From these calculated values, average leaf areas were found for each year and each kind of plot for the two species (Table 3).
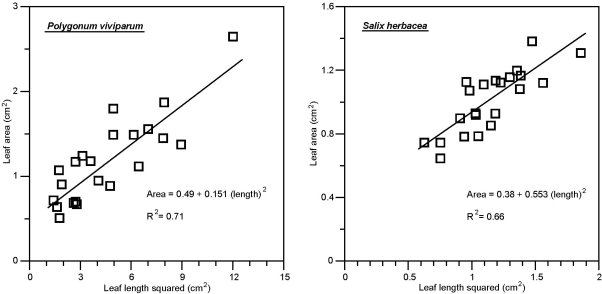
Figure 4. Measured leaf area plotted against leaf length squared for Polygonum viviparum (left panel) and for Salix herbacea (right panel). The regression lines and equations are indicated as well as the R2 values of the regressions.
Table 3a.Length (average ± standard error) and average area of Polygonum viviparum leaves in CtrlO, CtrlE and OTC for the years 2005, 2008 and 2011, respectively.
![]()
![]() CtrlO CtrlE OTC
CtrlO CtrlE OTC
![]() Year Length Area Length Area Length Area
Year Length Area Length Area Length Area
2005 1.81±0.07 1.02 1.92±0.10 1.11 3.24±0.13 2.20
2008 1.46±0.05 0.83 2.65±0.11 1.64 2.82±0.14 1.81
2011 1.89±0.08 1.28 2.80±0.12 1.77 3.66±0.15 2.66
Table 3b.Length (average ± standard error) and average area of Salix herbacea leaves in CtrlO, CtrlE and OTC for the years 2005, 2008 and 2011, respectively.
![]()
![]() CtrlO CtrlE OTC
CtrlO CtrlE OTC
![]() Year Length Area Length Area Length Area
Year Length Area Length Area Length Area
2005 0.55±0.02 0.56 0.55±0.02 0.56 0.86±0.03 0.82
2008 0.65±0.03 0.64 0.70±0.02 0.67 0.90±0.04 0.86
2011 0.88±0.03 0.84 1.02±0.03 0.98 1.20±0.03 1.19
The biomass index for graminoids was twice as high in OTC as in CtrlE and more than three times as high as in CtrlO (Table 4). For the woody species Salix herbacea, the relationship was almost the opposite with the lowest biomass index in OTC. For the herb Polygonum viviparum, there was no significant difference between OTC and CtrlE, but the biomass index for CtrlO was six times lower (Table 4).
Table 4. Biomass index of graminoids, Salix herbacea and Polygonum viviparum in OTC, CtrlE and CtrlO, respectively.
|
|
Graminoids |
Salix herbacea |
Polygonum viviparum |
|
OTC |
188 |
2 |
20 |
|
CtrlE |
95 |
4 |
18 |
|
CtrlO |
57 |
5 |
3 |
Discussion
Temperature
The soil temperature for the six years measured showed positive temperature response aboveground and negative temperature response belowground in the OTC´s (Table 1). The negative effect is in contrast to the response measured for most other sites where an increase of 2-4 °C was found (e.g. Marion et al. 1997) but a few sites also showed a negative belowground response (Shaver and Chapin, 1991; Marion et. al., 1997; Jónsdóttir et al., 2005). The positive temperature response was also much lower than expected for the OTC (Marion et al. 1997).
The lower difference in air temperature and the negative soil temperature difference in the boxes are usually explained by reduction of solar radiation by the OTC boxes, in combination with the insulating effect of the thicker vegetation cover (Marion et al., 1997; Jónsdóttir et al., 2005). In addition to this, the low number of sunshine hours and high cloudiness in the area could result in insufficient warming inside the OTC´s. Also, the humidity of the air inside the boxes may be affected and contribute to wetter and moister soil resulting in the negative difference in soil temperature. The OTC chambers may affect the vegetation in different ways, such as providing a sheltering effect. Thus, the differences in vegetation need not necessarily be due to temperature only.
Frequencies and vegetative growth
Although the temperature difference between OTC and control plots did not show the high positive response as expected, a clear response was seen in frequencies of some groups (Fig. 2), as well as in vegetative growth, both in leaf length, (Fig. 3) and leaf area (Table 3). The differences in leaf length imply differences in leaf area and one might expect the differences in area to be relatively much larger than the length differences. Due to the relatively high offsets (Fig. 4) in the regression lines, the area differences are, however, generally similar to the length differences.
Even though alpine plants are long-lived and well adapted to the environment, they respond to inter-annual changes in climate (e.g. Callaghan et al., 1989; Molau, 1993) and relatively small changes in temperature increase vegetative growth. As plant species have different temperature optima and tolerances (Fosaa et al., 2004), they respond individually to a warmer climate (Chapin and Shaver, 1985; Henry and Molau, 1997; Arft et al., 1999; Hollister et al., 2005). In some experiments it is seen that the leaf size increases (e.g. Henry and Molau, 1997; Molau, 2000).
Herbs
Studies on Polygonum viviparum (Chapin and Shaver, 1985; Wookey, 1994; Totland, 1998) have shown that the density and performance were negatively correlated and concluded that the density of the species was more controlled by safe sites than temperature. In the present study, no significant changes in frequency of Polygonum viviparum were seen in the OTC plots indicating that warming did not control the frequency of this species within a ten year experiment. The significant increase in biomass and leaf length is, in contrast, controlled by warming. These differences could be due to shading by the taller graminoids and that individuals that gain more light grow bigger leaves. This does not necessarily indicate a steady state of this species and the herbs growth form over years.
Woody species
The only woody species found at the site is Salix herbacea. The frequencies of this species decreased significantly in OTC and CtrlE (Fig. 2). This could indicate that Salix herbacea is less grazed than the more palatable herbs and graminoids. In alpine areas of neighbouring countries, dwarf shrubs are found to decline due to sheep grazing, but depending on grazing intensity (Austrheim et al., 2008; Olofsson, 2006). The grazing intensity of our study area is relatively heavy (Fosaa and Olsen 2007), which e.g. is seen on the flowering intensity inside and outside the enclosure, but Salix herbacea is a small prostrate species and may escape the grazers. In the latest synthesis on experimental warming (Elmendorf et al., 2012), the frequencies of dwarf shrubs are seen to decrease. Therefore, a possible explanation of the decrease of dwarf shrub frequency both in OTC and CtrlE could be competition from grasses.
Graminoids
In our study, the vegetative growth of graminoids increased both by warming and by the exclosure of grazing (Fig. 3). The frequency was also slightly increased by warming (Fig. 2), but was not significantly affected by grazing exclosure (Table 2). Arft et al.(1999) and Hollister et al. (2005) reported an increase in frequency of graminoids in OTC plots. Elmendorf et al. (2012) in the assessment of experimental warming on tundra vegetation also found a positive effect on graminoids at dryer colder sites. As expected, grazing exclosure also increased the biomass index of graminoids (Table 4), as heavy grazing often is found to reduce plant growth (e.g. Austrheim, 2008; Evju et al., 2009), thus resulting in smaller plants. Thus, the combined effect of grazing exclosure and warming had twice as strong effect on the biomass index as grazing exclosure alone.
Bryophytes
The frequency of bryophytes increased significantly in OTC and CtrlE relative to CtrlO (Fig. 2). This is consistent with other studies that have concluded that the frequency of bryophytes usually declines in grazed areas due to disturbance by trampling (Virtanen, 2000). The increased biomass of graminoids in OTC and CtrlE relative to CtrlO may also have generated a more humid microclimate in the bottom of the taller vegetation and hence a more optimal environment for pleurocarpic bryophytes to grow and increase. This is in contrast to the grazed plots, where the vegetation is sparser and less humid.
Conclusions
The effects of both warming and grazing exclusion seem to have a relatively rapid effect on the vegetative growth of the four functional types and all three species studied (Fig. 2 and Fig. 3). The effect on frequencies seems, however, more delayed with the most pronounced differences at the end of the experiment for those functional types (bryophytes and woody species) that have a clear response in line with Arft et al. (1999).
The result from this experiment is in line with the hypothesis in the introduction where it is expected that both grazing exclosure and experimental warming result in increased vegetative growth, and that the increase in vegetative growth would be greater in the warming experiment where the grazing also is excluded than in the exclosure.
Also in line with the hypothesis, the frequency and biomass of the functional types are responding differently as the woody species decline while the bryophytes increase from grazed through grazing exclosure to the OTC plots.
Acknowledgements
The author thanks the Museum of Natural History and its staff for help with establishment of the site, as well as for assistance in the field.
References
Arft, A.M., Walker, M.D., Gurevitch, J., Alatalo, J.M., Bret-Harte, M.S., Dale, M., Diemer, M., Gugerli, F., Henry, G.H.R., Jones, M.H., Hollister, R., Jónsdóttir, I.S., Laine, K., Lévesque, E., Marion, G.M., Molau, U., Mølgaard, P., Nordenhäll, U., Raszhivin, V., Robinson, C.H., Starr, G., Stenström, A., Stenström, M., Totland, Ø., Turner, L.,Walker, L., Webber, P., Welker, J.M. and Wookey, P.A . 1999. Response patterns of tundra plant species to experimental warming: a meta-analysis of the International Tundra Experiment. Ecological Monographs 64: 491–511.
Austrheim, G., Mysterud, A., Pedersen, B., Halvorsen, R., Hassel, K. and Evju, M. 2008. Large-scale experimental effects of three levels of sheep densities on an alpine ecosystem. Oikos 117:837–846. http://dx.doi.org/10.1111/j.0030-1299.2008.16543.x.
Burga, C.A. and Perret, T. 2001. Monitoring of eastern and southern Swiss alpine timberline ecotones. In: Burga, C.A. and Kratochwil, A. (eds) Biomonitoring: general and applied aspects on regional and global scales. Kluwer Academic Publishers, Dordrecht, Boston, London: 179-194. http://dx.doi.org/10.1007/978-94-015-9686-2_11.
Callaghan, T., Carlsson, B.Å. and Tyler, N.J.C. 1989. Historical records of climate-related growth in Cassiope tetragona from Arctic. Journal of Ecology 77: 823-827. http://dx.doi.org/10.2307/2260988.
Cappelen, J., Laursen, E.V. 1998. The climate of the Faroe Islands – with climatological standard normals, 1961–1991. Danish Meterological Institute. Technical report 98–14. Copenhagen, DK.
Chapin, F.S. III, and Shaver, G.R., 1985. Individualistic growth response of tundra plant species to environmental manipulations in the field. Ecology 66: 564-576. http://dx.doi.org/10.2307/1940405.
Christiansen, H.H. and Mortensen, L.E. 2002. Arctic mountain meteorology at the Sornfelli mountain in year 2000 in the Faroe Islands. Fróðskaparrit 50: 93–110.
Elmendorf, S., Henry, G., Bjorkman, A., Hollister, R., Björk, R., Callaghan, T., Collier, L., Cooper, E., Cornelissen, H., Day, T., Fosaa, A.M., Gould, W., Grétarsdóttir, J., Harte, J., Hermanutz, L., Hik, D., Hofgaard, A., Jarrad, F., Jónsdóttir, I.S., Keuper, F., Klanderud, K., Klein, J., Koh, S., Kudo, G., Lang, S., Loewen, V., May, J., Mercado, J., Michelsen, A., Molau, U., Myers-Smith, I., Oberbauer, S., Pieper, S., Post, E., Rixen, C., Robinson, C., Schmidt, N., Shaver, G., Stenström, A., Tolvanen, A., Totland, O., Troxler, T., Wahren, C.H., Webber, P., Welker, J. and Wookey, P. 2012. Global assessment of experimental climate warming on tundra vegetation: heterogeneity over space and time. Ecology Letters 15: 164-175. http://dx.doi.org/10.1111/j.1461-0248.2011.01716.x.
Evju, M., Austrheim, G., Halvorsen, R. and Mysterud, A. 2009. Grazing responses in herbs in relation to herbivore selectivity and plant traits in an alpine ecosystem. Oecologia 161:77–85. http://dx.doi.org/10.1007/s00442-009-1358-1.
Fosaa, A.M. 2004. Altitudinal distribution of plant communities in the Faroe Islands. Fróðskaparrit 51: 200-211.
Fosaa, A.M., Lawesson, J.E., Sykes, M.T. and Gaard, M. 2004. Potential effects of climate change on the vegetation in the Faroe Islands. Global Ecology and Biogeography 13: 427-437. http://dx.doi.org/10.1111/j.1466-822X.2004.00113.x.
Fosaa A.M. and Olsen, E. 2007. The impact of grazing on mountain vegetation and the arbuscular mycorrhizal symbiont. Fróðskaparrit 55:177-187.
Fosaa, A.M. 2010. The vertical distribution of the vegetation in the Faroe Islands past present, south and north. In: Dorete –her book, Bengtson S-A, Buckland P., Enckell, P.H. and Fosaa A.M. (eds.) Annales Societatis Scientiarum Færoensis Supplementum 52.
Fuhlendorf, S.D., Briske, D.D. and Seimens, F.E. 2001. Herbaceous vegetation change in variable rangeland environments: The relative contribution of grazing and climatic variability. Applied Vegetation Science 4: 177-188. http://dx.doi.org/10.1111/j.1654-109X.2001.tb00486.x.
Hollister, R.D. and Webber, P.J. 2000 Biotic validation of small open-top chambers in a tundra ecosystem Global Change Biology 6 : 835–842. http://dx.doi.org/10.1046/j.1365-2486.2000.00363.x
Hollister, R.D., Webber, P.J. and Tweedie, C.E. 2005. The response of Alaskan arctic tundra to experimental warming: differences between short- and long-term responses. Global Change Biology 11: 525–536. http://dx.doi.org/10.1111/j.1365-2486.2005.00926.x.
Henry, G.H.R. and Molau, U. 1997. Tundra plants and climate change: the International Tundra Experiment (ITEX). Global Change Biology 3, (Suppl. 1) 1-9. http://dx.doi.org/10.1111/j.1365-2486.1997.gcb132.x.
Jóhansen, J. 1985. Studies in vegetational history of the Faroe and Shetland Islands. Annales Societatis Scientiarum Færoensis Supplementum 11.
Jónsdóttir, I.S., Magnussen, B., Gudmundsson, .J, Elmarsdóttir, Á. and Hjartarson, H.2005. Variable sensitivity of plant communities in Iceland to experimental warming. Global Change Biology 11: 553–563. http://dx.doi.org/10.1111/j.1365-2486.2005.00928.x.
Klein, A.J., Harte, J. and Xin-Quan, Z. 2005. Dynanamic and comples microclimate responses to warming and grazing manipulations. Global Change Biology 11: 1440-1451. http://dx.doi.org/10.1111/j.1365-2486.2005.00994.x
Marion, G.M., Henry, G.H.R., Freeman, D.W., Johnstone, J., Jones, G., Johnes, M.H. Lévesque, E. Molau, U. Mølgaard, P., Parsons, A.N. Svoboda, J. and Virginia, R.A. 1997. Open-top designs for manipulating field temperature in high-latitude ecosystems. Global Change Biology 3 (suppl. 1) 20-32. http://dx.doi.org/10.1111/j.1365-2486.1997.gcb136.x.
Molau, U. 1993. Relationship between flowering phenology and life history strategies int undra plants. Arctic and Alpine Research 25: 391-402. http://dx.doi.org/10.2307/1551922.
Molau, U. and Møhlgaard, P. 1996. ITEX manual.85 p. Danish Polar Center Copenhagen.
Molau, U. 2000. Tundra plant responses to experimental and natural temperature change. Memorirs of National Institure of Polar research, Special issue 54: 445-466.
Olofsson, J. 2006., Short- and long-term effects of changes in reindeer grazing pressure on tundra heath vegetation. Journal of Ecology 94: 431-440. http://dx.doi.org/10.1111/j.1365-2745.2006.01100.x.
Olofsson, J., Oksanen, L., Callaghan, T., Humle, P.E., Oksanen, T. and Suominen, O. 2009. Herbivores inhibit climate-driven shrub expansion on the tundra. Global Change Biology 15: 2681:2693. http://dx.doi.org/10.1111/j.1365-2486.2009.01935.x
Oberbauer, S.F., Elmendorf, S., Troxler, T.G., Hollister, R.D., Rocha, A.V., Brete-Harte, M.S., Dawes, M. A., Fosaa, A.M., Henry, G.H.R., Høye, T.T., Jarrad, F.C., Jónsdóttir, I.S., Klanderud, K., Klein, J.A., Molau, U., Rixen, C.,Schmidt, N.M, Shaver, G.R., Slider, R., Totland, Ø., Wahren, C.H. and Welker, J.W. 2013. Phenological response of tundra plants to background climate variation tested using the International Tundra Experiment. Philosophical Transactions of the Royal Society B. 368:20120481. http://dx.doi.org/10.1098/rstb.2012.0481.
Shaver, G.R. and Chapin F.S.III. 1991 Production: Biomass relationship and element cycling in contrasting Arctic vegetation types. Ecological Monographs 61: 1-31. http://dx.doi.org/10.2307/1942997.
Speed, J. D.M., Austrheim, G., Birks, H.J.B., Johnson, S., Kvamme, M., Nagy, L., Sjögren, P., Skar, B., Stone, D., Svensson, E. and Thompson, D. B.A. 2012. Natural and cultural heritage in mountain landscapes: towards an integrated valuation. International Journal of Biodiversity Science, Ecosystem Services & Management 8: 4, 313-320. http://dx.doi.org/10.1080/21513732.2012.725226.
Totland, Ø., and Nylen J. 1998. Assessment of the effects of environmental change on the performance and density of Bistorta vivipara: the use of multivariate analysis and experimental manipulation. Journal of Ecology 86: 989-998. http://dx.doi.org/10.1046/j.1365-2745.1998.00318.x.
Thorsteinsson, K. 2001. Hagar og seyðamark. (In Faroese). Føroya Jarðarráð, Tórshavn, Faroe Islands.
van der Wal, R. 2006. Do herbivores cause habitat degradation or vegetation state transition? Evidence from the tundra. Oikos 114: 177-186. http://dx.doi.org/10.1111/j.2006.0030-1299.14264.x.
Walther, G.R., Beißner, S. and Pott, R. 2005. Climate change and high mountain vegetation shifts. In Broll, G. and Keplin, B. (eds) Mountain ecosystems — studies in treeline ecology. Springer, Berlin, Heidelberg: 77–96. http://dx.doi.org/10.1007/3-540-27365-4_3.
Wookey, P.A., Welker, J.M., Parsons, A.N., Press, M.C., Callaghan, T.V., and Lee J.A. 1994. Differential growth, allocation and photosynthetic responses of Polygonum viviparum to simulated environmental change at a high Arctic polar semi-desert. Oikos. 70: 131-139. http://dx.doi.org/10.2307/3545708.
Virtanen, R. 2000. Effects of grazing on above-ground biomass on a mountain snowbed, NW Finland. Oikos 90: 295-300. http://dx.doi.org/10.1034/j.1600-0706.2000.900209.x.